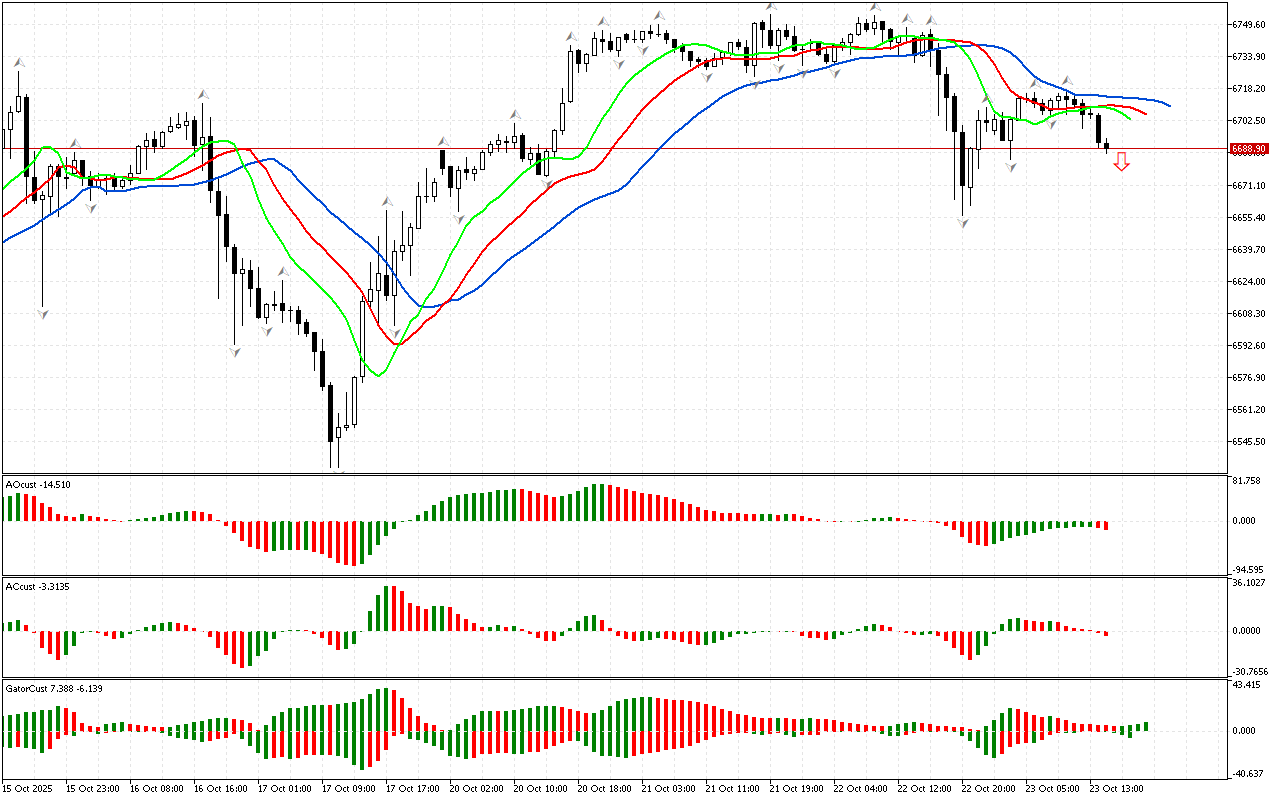
The price has fallen below the lower fractal on the chart. This defines the phase space as southern. Accordingly, the most probable scenario for the price change is its decrease. To assess the prospects for the development of this movement, other market dimensions will be analyzed.
An inverse Saucer signal has appeared on the Awesome Oscillator indicator. It indicates a possible change in the direction of the market to downward. When this entry point signal appears, the market can be considered when the price falls below the local minimum.
The AC and AO indicators are in the red zone, which indicates that there are strength and energy to continue the downward movement.
A series of green bars is drawn in the Gator indicator. This shows the Alligator’s gluttony. The Hungry Alligator period is the time when a trend movement develops in the market.
As an epilogue to the analysis, the southern direction of price movement is noted to be considered as a priority. At the same time, the indicators contain signals about the possible development of a correction, which should be used to search for entry points at more beneficial prices.
📊 Sell Stop 6686.78
❌ Stop Loss 6707.36
After entering the market, Stop Loss is moved along the red line after closing each candle. The profit is fixed by moving Stop Loss, or when opposite signals appear on the AO, AC, Gator indicators.