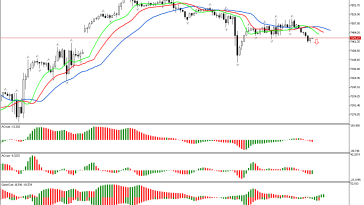
The price has risen above the upper fractal located above the Alligator’s mouth on the chart. Due to this signal, we define the phase space as a northern one and can examine the following 3 dimensions of the market.
Alligator lines also have laid in a northerly direction. This is a positive signal. Bill Williams compared this indicator to a compass, which determines the prevalence of the direction of price movement.
At the same time, the Awesome Oscillator histogram is currently above the zero line.
The two green bars above the zero line on the AC indicator signal an increase in positive sentiment in the market. The energy of the current market phase is growing.
In general, the signals from the AC and AO indicators show that there is sufficient strength and energy in the market to continue the upward movement.
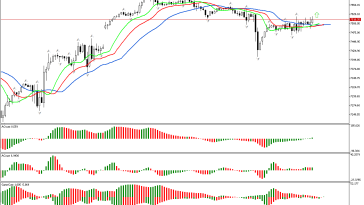
The AO, AC and Gator indicators are entrenched in the green zone. It predicts a continuation of movement in the northern direction. The strength and energy of the phase increases. The Alligator’s lines spread out, opening its mouth wider.
Several green columns in a row have been formed on the Gator indicator. This indicates that the Alligator is hungry and its appetite is increasing.
Let’s summarize. The phase space is determined to be northern after the price has risen above the upper fractal. Signals from other indicators strengthen this signal and prove the prevalence of the upward vector of price movement.
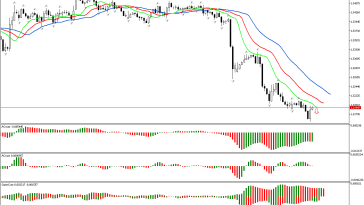
📊 Buy Stop 4081.68
❌ Stop Loss 3934.77
After entering the market, Stop Loss is carried along the red line after the closing of each candle. The profit is fixed by moving Stop Loss, or when opposite signals appear on the AO, AC, Gator indicators.
Ethereum H1: The Chaos Theory Forecast for the American Session on 26.10.2025