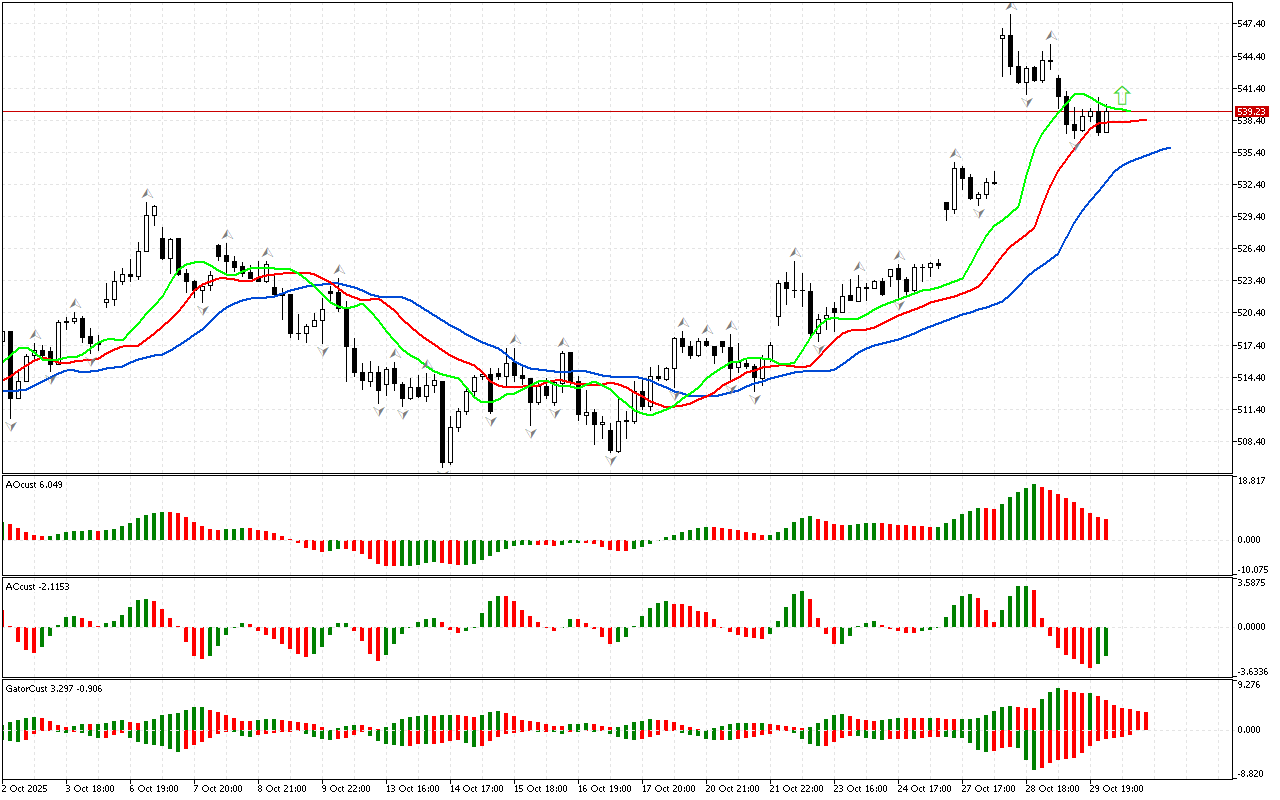
Traditionally, the review begins with examination of the first market dimension. The price has risen above the upper fractal. This defines the phase space as northern. This signal indicates the possible development of an upward movement. To assess its strength and energy, let’s consider other market dimensions within the framework of Bill Williams’ strategy.
The Alligator indicator confirms the positive market sentiment. The Alligator’s mouth is open. It’s hungry. Against this background, the price may continue to rise.
The AO indicator is still above the zero mark.
The histogram of the Gator indicator has not formed a clear signal yet. The color of the histograms changes, indicating a change in market phase.
A series of red bars is drawn on the Gator indicator. This signal shows the formation of a correction.
As a result, there is a northern phase space. At the same time, some indicators indicate the possible development of a pullback movement or the transition of the market to a new phase.
📊 Buy Stop 545.43
❌ Stop Loss 532.38
After entering the market, Stop Loss is carried along the red line after the closing of each candle. The profit is fixed by moving Stop Loss, or when opposite signals appear on the AO, AC, Gator indicators.
Microsoft H1: The Chaos Theory Forecast for the American Session on 30.10.2025