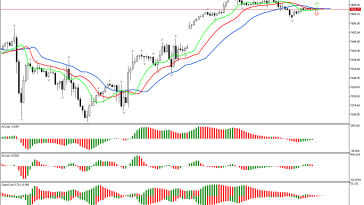
Traditionally, the review begins with examination of the first market dimension. The price has risen above the upper fractal. This defines the phase space as northern. This signal indicates the possible development of an upward movement. To assess its strength and energy, let’s consider other market dimensions within the framework of Bill Williams’ strategy.
Alligator lines also have laid in a northerly direction. This is a positive signal. Bill Williams compared this indicator to a compass, which determines the prevalence of the direction of price movement.
At the same time, the Awesome Oscillator histogram is currently above the zero line.
The latest bars on the AC and AO charts are colored red. This is a signal that the strength and energy of the upward movement have deceleration. This signal does not contradict the prevalence of the upward movement, but indicates the development of a correction.
Several green columns in a row have been formed on the Gator indicator. This indicates that the Alligator is hungry and its appetite is increasing.
As a result, there is a northern phase space. At the same time, some indicators indicate the possible development of a pullback movement or the transition of the market to a new phase.
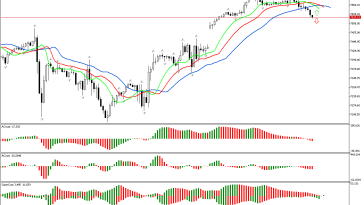
📊 Buy Stop 6691.66
❌ Stop Loss 6628.29
After entering the market, Stop Loss is carried along the red line after the closing of each candle. The profit is fixed by moving Stop Loss, or when opposite signals appear on the AO, AC, Gator indicators.