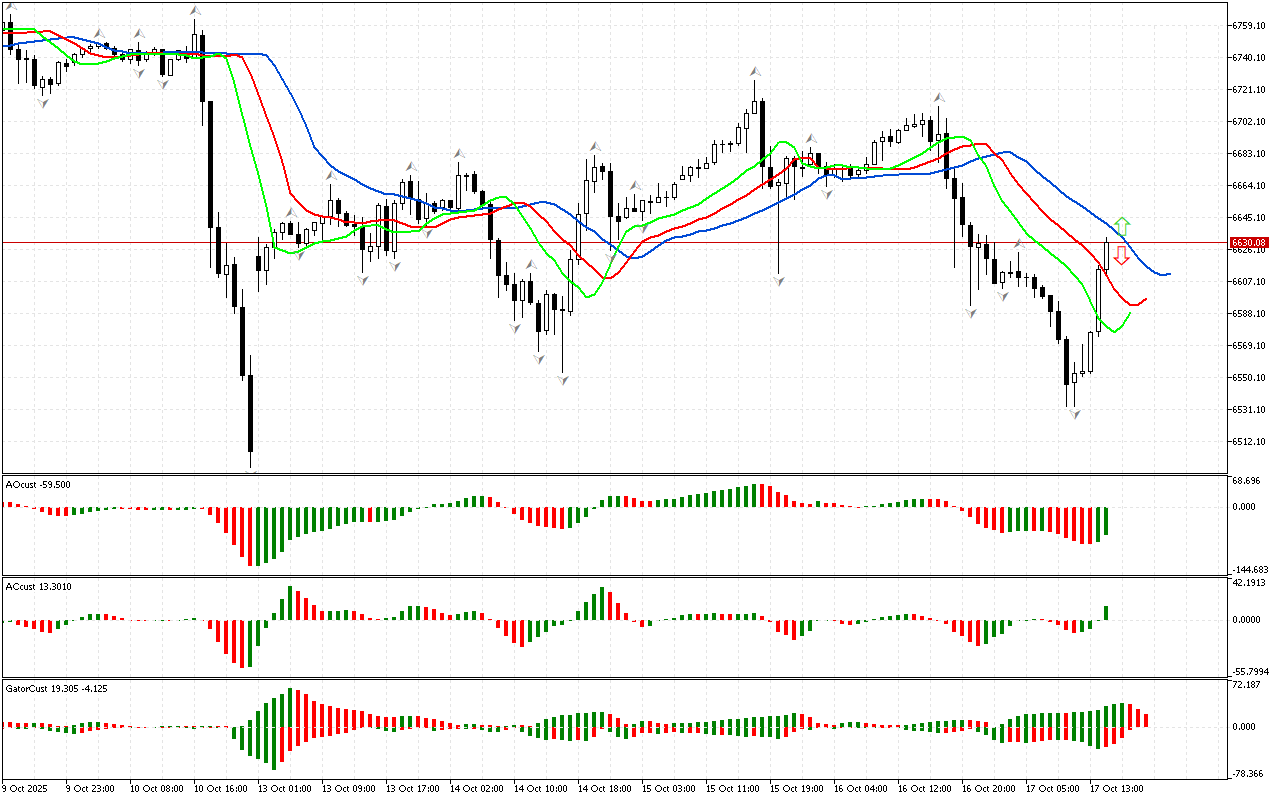
The analysis of the S&P 500 graph shows that the phase space is undefined. The price is between two fractals that can be used to determine the state of the market. According to Bill Williams’ Chaos Theory, attention should be paid only to fractals that are outside the Alligator’s mouth boundaries. Therefore, to determine the further prevalent direction of price movement, it is worth waiting for the price to cross the fractal.
The alligator remains active, indicating a possible continuation of movement in the market.
At the same time, the AO indicator remains in the negative zone.
The color of the histograms of the Gator indicator changes, so this indicator has not formed a clear signal yet.
Let’s summarize. The phase space is not defined. Therefore, it is worth ignoring the signals of other indicators for now and waiting for the breakdown of one of the fractals. This is a predictive event that will help determine the market phase and the priority direction of price movement.
📊 Buy Stop 6711.08
❌ Stop Loss 6681.02
✔️ Sell Stop 6532.77
❌ Stop Loss 6631.75
After entering the market, Stop Loss is moved along the red line after the closing of each candle. The profit is fixed by moving Stop Loss, or when impulse weakening signals appear on the AO, AC, Gator indicators.
S&P 500 H1: The Chaos Theory Forecast for the American Session on 17.10.2025