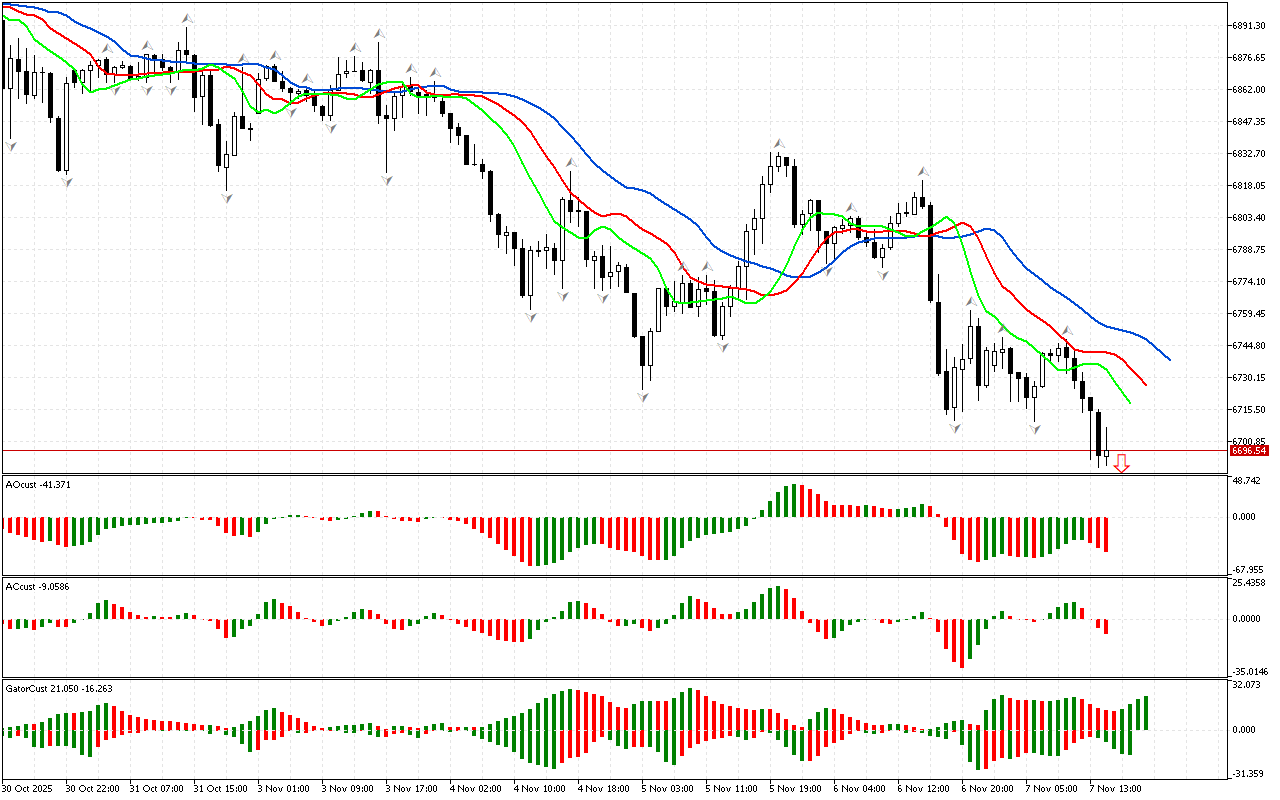
The review of the S&P 500 chart traditionally begins with the analysis of the first dimension of the market. The price has fallen below the lower fractal. It means the phase space is defined as southern. Accordingly, now other market dimensions can be examined to assess the opportunities for trading positions opening.
The alligator is active and ready to hunt: its lines laid in a typical for the development of a downward movement order.
At the same time, the AO indicator remains in the negative zone.
Signals from the AC and AO indicators indicate that the market has sufficient strength and energy to reduce the price further.
Several green columns in a row have been formed on the Gator indicator. This indicates that the Alligator is hungry and its appetite is increasing.
As an epilogue to the analysis, the southern direction of price movement is noted to be considered as a priority. At the same time, the indicators contain signals about the possible development of a correction, which should be used to search for entry points at more beneficial prices.
📊 Sell Stop 6688.97
❌ Stop Loss 6757.97
After entering the market, Stop Loss is moved along the red line after closing each candle. The profit is fixed by moving Stop Loss, or when opposite signals appear on the AO, AC, Gator indicators.
S&P 500 H1: The Chaos Theory Forecast for the American Session on 7.11.2025