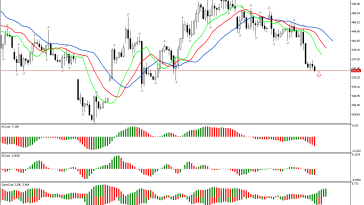
Traditionally, the review begins with examination of the first market dimension. The price has risen above the upper fractal. This defines the phase space as northern. This signal indicates the possible development of an upward movement. To assess its strength and energy, let’s consider other market dimensions within the framework of Bill Williams’ strategy.
Despite the fact that the phase space is defined as northern, the trend of the Alligator lines is horizontal. This does not replace the previous signal, but indicates continued uncertainty in the market because the Alligator is sleeping.
At the same time, the Awesome Oscillator histogram is currently above the zero line.
The red bars located above the zero mark on the Accelerator Oscillator indicator show a decrease in the energy of the upward movement. However, as long as the price remains above the Alligator’s red line, the price growth is expected.
Several green columns in a row have been formed on the Gator indicator. This indicates that the Alligator is hungry and its appetite is increasing.
As a result, there is a northern phase space. At the same time, some indicators indicate the possible development of a pullback movement or the transition of the market to a new phase.
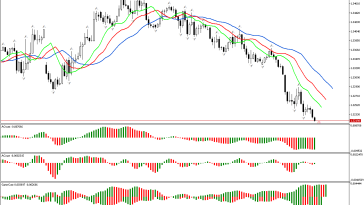
📊 Buy Stop 6020.88
❌ Stop Loss 5984.60
After entering the market, Stop Loss is carried along the red line after the closing of each candle. The profit is fixed by moving Stop Loss, or when opposite signals appear on the AO, AC, Gator indicators.
S&P 500 H1: The Chaos Theory Forecast for the American Session on 16.6.2025