S&P 500 H1: The Chaos Theory Forecast for the Asian Session on 26.2.2026
According to S&P 500, the phase space is defined as northern, since the price has risen above the upper fractal. Now we can examine signals from other market dimensions within…
Analytics
According to S&P 500, the phase space is defined as northern, since the price has risen above the upper fractal. Now we can examine signals from other market dimensions within…
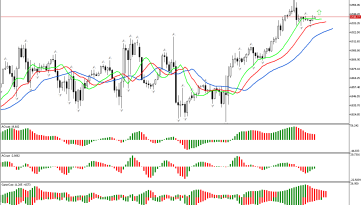
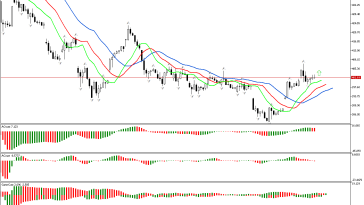
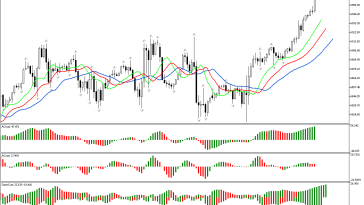
An analysis of the first phase of the market begins the review. The price is noted to have risen above the upper fractal on the chart. It determines the direction…
The price has risen above the upper fractal located above the Alligator’s mouth on the chart. Due to this signal, we define the phase space as a northern one and…
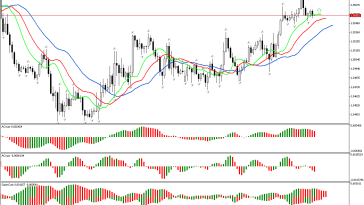
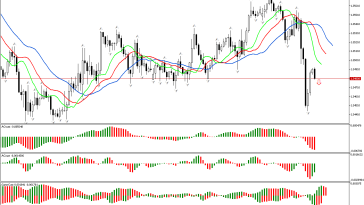
The analysis of the GBPUSD graph shows that the phase space is undefined. The price is between two fractals that can be used to determine the state of the market.…
According to S&P 500, the phase space is defined as northern, since the price has risen above the upper fractal. Now we can examine signals from other market dimensions within…
The price has risen above the upper fractal located above the Alligator’s mouth on the chart. Due to this signal, we define the phase space as a northern one and…
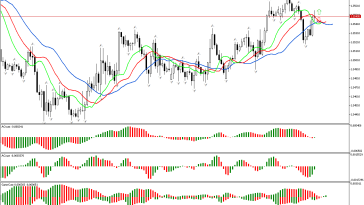
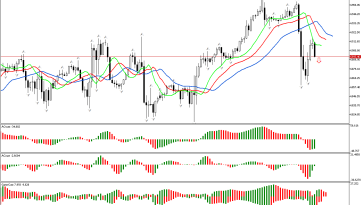
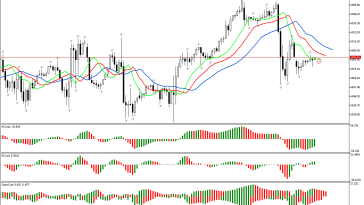
The price has fallen below the lower fractal on the chart. This defines the phase space as southern. Accordingly, the most probable scenario for the price change is its decrease.…
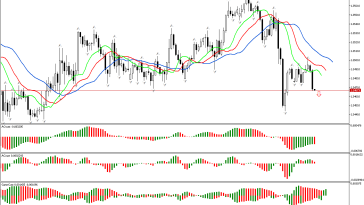
The price has fallen below the lower fractal on the chart. This defines the phase space as southern. Accordingly, the most probable scenario for the price change is its decrease.…
The price has fallen below the lower fractal on the chart. This defines the phase space as southern. Accordingly, the most probable scenario for the price change is its decrease.…
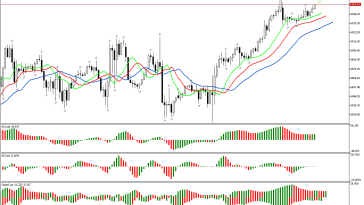
The review of the S&P 500 chart traditionally begins with the analysis of the first dimension of the market. The price has fallen below the lower fractal. It means the…