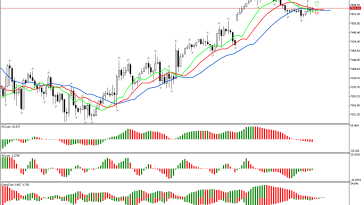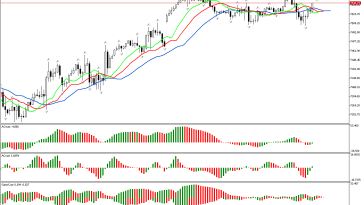
S&P 500 H1: The Chaos Theory Forecast for the Asian Session on 28.5.2026
First of all, let’s examine the first market dimension which is a key point in determination the further strategy of behavior of a trader or investor within the framework of…
Analytics
First of all, let’s examine the first market dimension which is a key point in determination the further strategy of behavior of a trader or investor within the framework of…
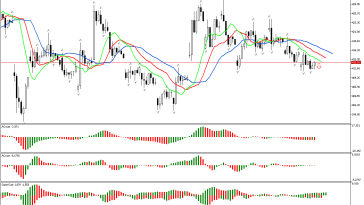
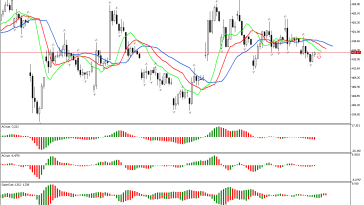
The price has fallen below the lower fractal on the Microsoft chart. This means the phase space is defined as southern. Against this background, the downward movement development is considered…
First of all, let’s examine the first market dimension which is a key point in determination the further strategy of behavior of a trader or investor within the framework of…
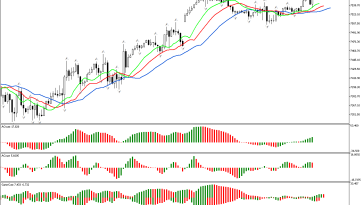
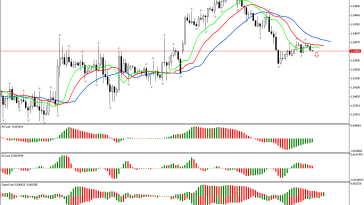
The further direction of movement for GBPUSD hasn’t been defined yet. The phase space remains undefined. Against this background, it’s worth being patient and waiting for the price to rise…
First of all, let’s examine the first market dimension which is a key point in determination the further strategy of behavior of a trader or investor within the framework of…
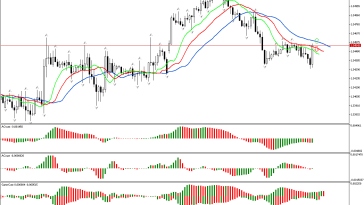
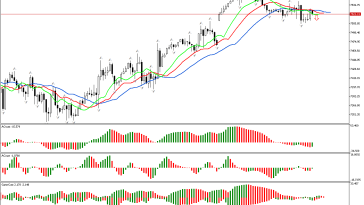
The review begins with the analysis of the first dimension of the market. The price has fallen below the lower fractal, located outside the Alligator’s mouth. Therefore, the phase space…
The analysis of the current market situation shows that the phase space is defined as southern. The price has fallen below the lower fractal. This may indicate the beginning of…
The price has fallen below the lower fractal on the chart. This defines the phase space as southern. Accordingly, the most probable scenario for the price change is its decrease.…
The price has fallen below the lower fractal on the chart. This defines the phase space as southern. Accordingly, the most probable scenario for the price change is its decrease.…
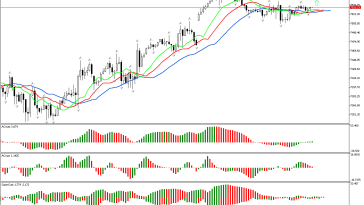
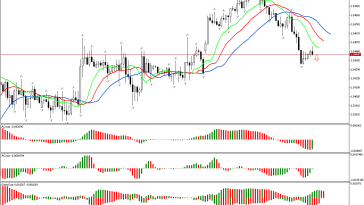
The further direction of movement for S&P 500 hasn’t been defined yet. The phase space remains undefined. Against this background, it’s worth being patient and waiting for the price to…