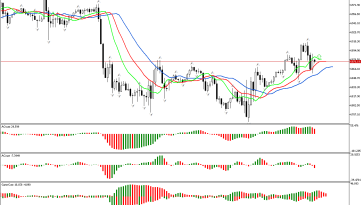
S&P 500 H1: The Chaos Theory Forecast for the American Session on 19.2.2026
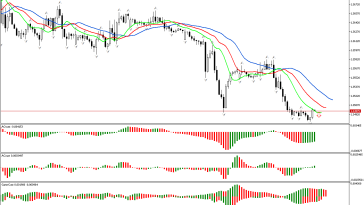
The review of the S&P 500 chart traditionally begins with the analysis of the first dimension of the market. The price has fallen below the lower fractal. It means the…
Analytics
The review of the S&P 500 chart traditionally begins with the analysis of the first dimension of the market. The price has fallen below the lower fractal. It means the…
The analysis of the current market situation shows that the phase space is defined as southern. The price has fallen below the lower fractal. This may indicate the beginning of…
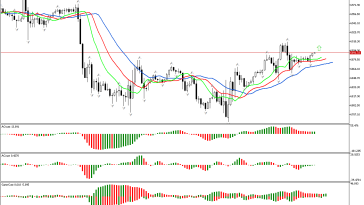
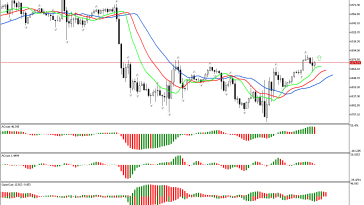
The price has risen above the upper fractal located above the Alligator’s mouth on the chart. Due to this signal, we define the phase space as a northern one and…
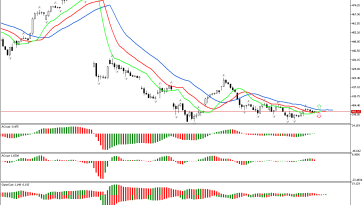
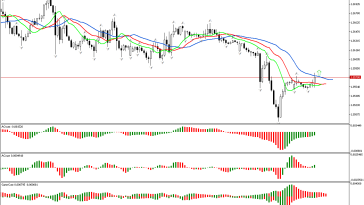
The market situation regarding Microsoft is not defined. The price did not fall below and did not rise above any of the fractals. Therefore, the signals from other indicators should…
The market situation regarding Microsoft is not defined. The price did not fall below and did not rise above any of the fractals. Therefore, the signals from other indicators should…
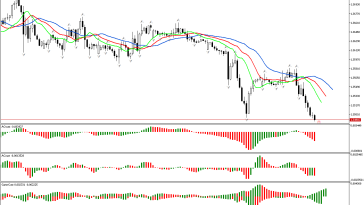
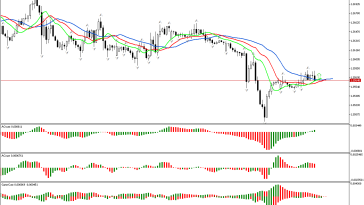
The price has fallen below the lower fractal on the GBPUSD chart. This means the phase space is defined as southern. Against this background, the downward movement development is considered…
First of all, let’s examine the first market dimension which is a key point in determination the further strategy of behavior of a trader or investor within the framework of…
The price has risen above the upper fractal located above the Alligator’s mouth on the chart. Due to this signal, we define the phase space as a northern one and…
An analysis of the first phase of the market begins the review. The price is noted to have risen above the upper fractal on the chart. It determines the direction…
Traditionally, the review begins with examination of the first market dimension. The price has risen above the upper fractal. This defines the phase space as northern. This signal indicates the…