
Microsoft H1: The Chaos Theory Forecast for the American Session on 29.6.2026
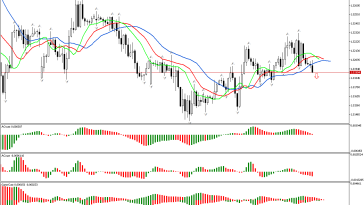
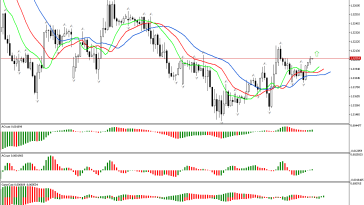
The price has risen above the upper fractal located above the Alligator’s mouth on the chart. Due to this signal, we define the phase space as a northern one and…
Analytics
The price has risen above the upper fractal located above the Alligator’s mouth on the chart. Due to this signal, we define the phase space as a northern one and…
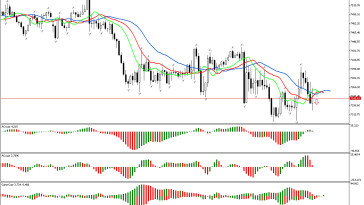
The analysis of the current market situation shows that the phase space is defined as southern. The price has fallen below the lower fractal. This may indicate the beginning of…
There remains uncertainty regarding S&P 500. The price neither fell below, nor rose above any fractal. In this situation, it is worth refraining from active actions in the market and…
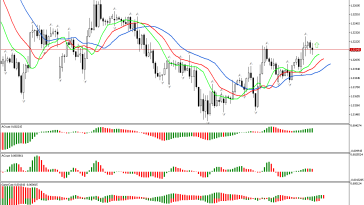
Traditionally, the review begins with examination of the first market dimension. The price has risen above the upper fractal. This defines the phase space as northern. This signal indicates the…
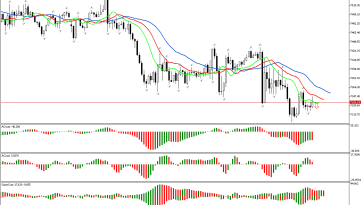
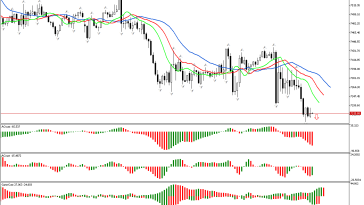
The price has fallen below the lower fractal on the S&P 500 chart. This means the phase space is defined as southern. Against this background, the downward movement development is…
The analysis of the current market situation shows that the phase space is defined as southern. The price has fallen below the lower fractal. This may indicate the beginning of…
Traditionally, the review begins with examination of the first market dimension. The price has risen above the upper fractal. This defines the phase space as northern. This signal indicates the…
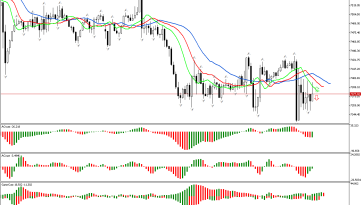
The analysis of the S&P 500 graph shows that the phase space is undefined. The price is between two fractals that can be used to determine the state of the…
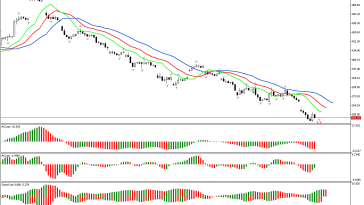
The review begins with the analysis of the first dimension of the market. The price has fallen below the lower fractal, located outside the Alligator’s mouth. Therefore, the phase space…
The price has risen above the upper fractal located above the Alligator’s mouth on the chart. Due to this signal, we define the phase space as a northern one and…