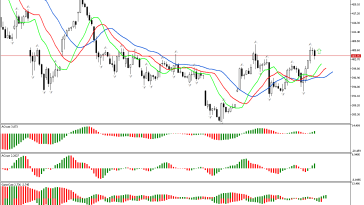
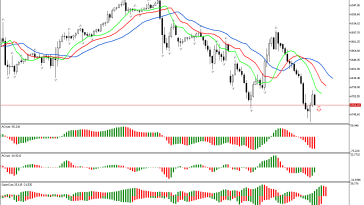
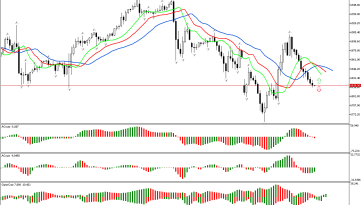
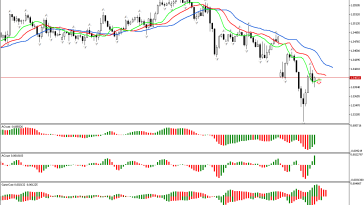
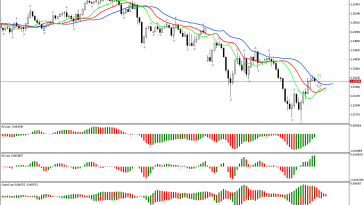
S&P 500 H1: The Chaos Theory Forecast for the Asian Session on 13.6.2025
The price has risen above the upper fractal located above the Alligator’s mouth on the chart. Due to this signal, we define the phase space as a northern one and…
Analytics
The price has risen above the upper fractal located above the Alligator’s mouth on the chart. Due to this signal, we define the phase space as a northern one and…
According to GBPUSD, the phase space is defined as northern, since the price has risen above the upper fractal. Now we can examine signals from other market dimensions within the…
Traditionally, the review begins with examination of the first market dimension. The price has risen above the upper fractal. This defines the phase space as northern. This signal indicates the…
The review of the S&P 500 chart traditionally begins with the analysis of the first dimension of the market. The price has fallen below the lower fractal. It means the…
First of all, let’s examine the first market dimension which is a key point in determination the further strategy of behavior of a trader or investor within the framework of…
The review of the S&P 500 chart traditionally begins with the analysis of the first dimension of the market. The price has fallen below the lower fractal. It means the…
An analysis of the first phase of the market begins the review. The price is noted to have risen above the upper fractal on the chart. It determines the direction…
Traditionally, the review begins with examination of the first market dimension. The price has risen above the upper fractal. This defines the phase space as northern. This signal indicates the…