S&P 500 H1: The Chaos Theory Forecast for the European Session at 18.6.2025
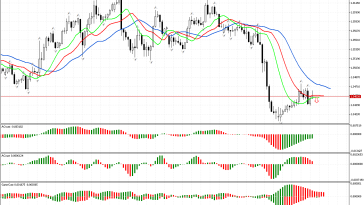
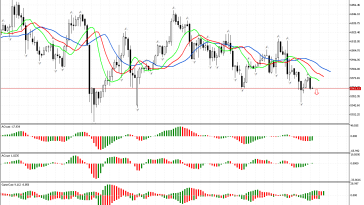
The analysis of the S&P 500 graph shows that the phase space is undefined. The price is between two fractals that can be used to determine the state of the…
Analytics
The analysis of the S&P 500 graph shows that the phase space is undefined. The price is between two fractals that can be used to determine the state of the…
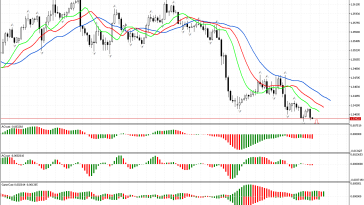
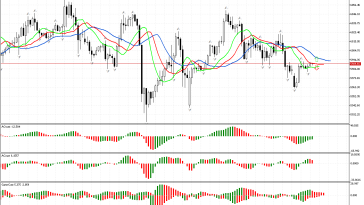
The price has fallen below the lower fractal on the chart. This defines the phase space as southern. Accordingly, the most probable scenario for the price change is its decrease.…
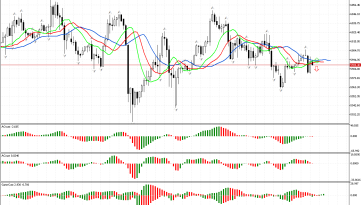
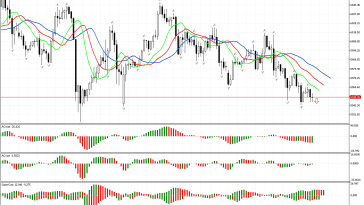
The market situation regarding S&P 500 is not defined. The price did not fall below and did not rise above any of the fractals. Therefore, the signals from other indicators…
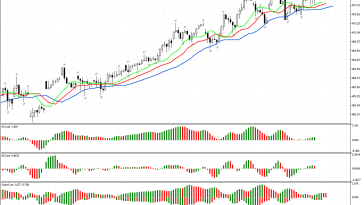
The price has risen above the upper fractal located above the Alligator’s mouth on the chart. Due to this signal, we define the phase space as a northern one and…
The review begins with the analysis of the first dimension of the market. The price has fallen below the lower fractal, located outside the Alligator’s mouth. Therefore, the phase space…
The review begins with the analysis of the first dimension of the market. The price has fallen below the lower fractal, located outside the Alligator’s mouth. Therefore, the phase space…
The price has fallen below the lower fractal on the chart. This defines the phase space as southern. Accordingly, the most probable scenario for the price change is its decrease.…
The price has fallen below the lower fractal on the chart. This defines the phase space as southern. Accordingly, the most probable scenario for the price change is its decrease.…
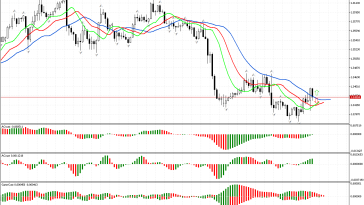
At the moment, the further direction of movement for GBPUSD is not defined. The phase space remains undefined. It is worth being patient and waiting for the price to rise…
The price has fallen below the lower fractal on the chart. This defines the phase space as southern. Accordingly, the most probable scenario for the price change is its decrease.…