
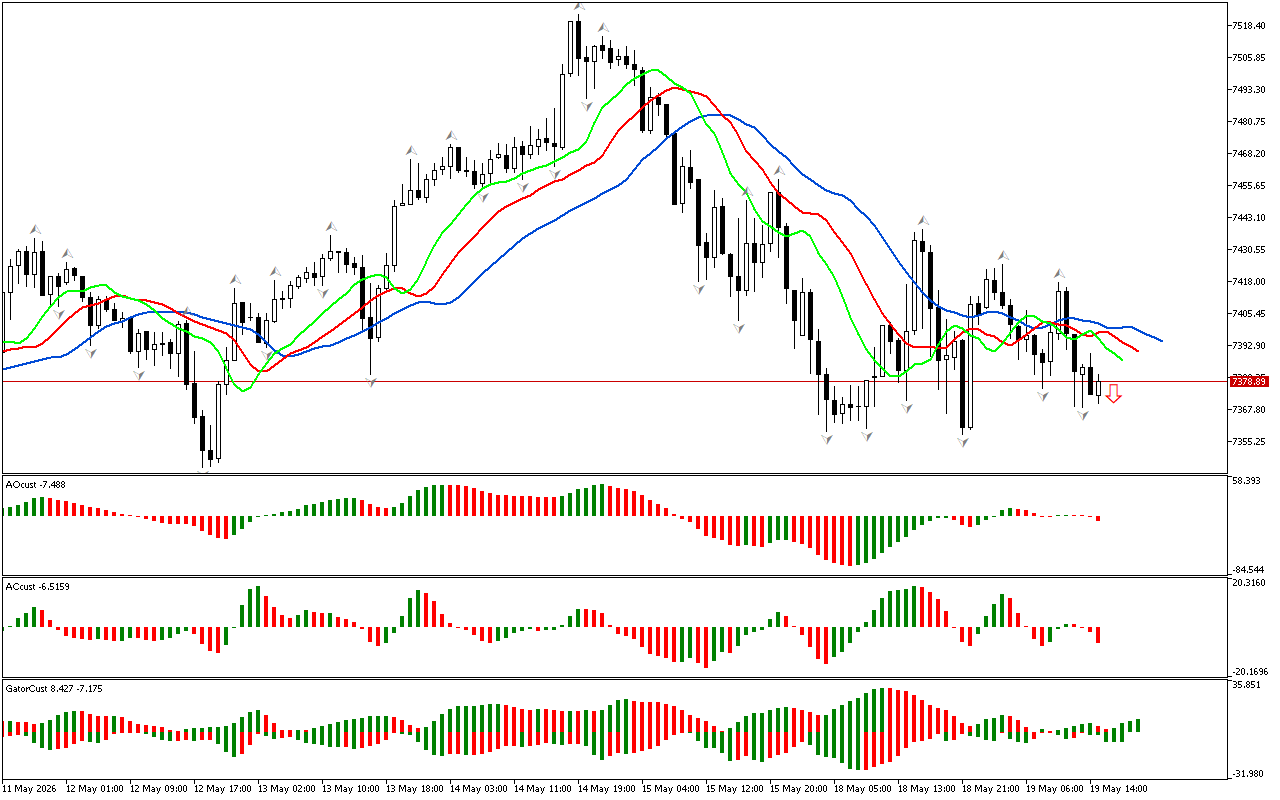
The price has fallen below the lower fractal on the chart. This defines the phase space as southern. Accordingly, the most probable scenario for the price change is its decrease. To assess the prospects for the development of this movement, other market dimensions will be analyzed.
On the chart of the AO indicator, there is the zero line crossing from top to bottom. This is a sign indicating the market has sufficient strength to continue the movement in a southern direction.
Signals from the AC and AO indicators indicate that the market has sufficient strength and energy to reduce the price further.
Several green columns in a row have been formed on the Gator indicator. This indicates that the Alligator is hungry and its appetite is increasing.
As an epilogue to the analysis, the southern direction of price movement is noted to be considered as a priority. At the same time, the indicators contain signals about the possible development of a correction, which should be used to search for entry points at more beneficial prices.
📊 Sell Stop 7368.76
❌ Stop Loss 7396.79
After entering the market, Stop Loss is moved along the red line after closing each candle. The profit is fixed by moving Stop Loss, or when opposite signals appear on the AO, AC, Gator indicators.