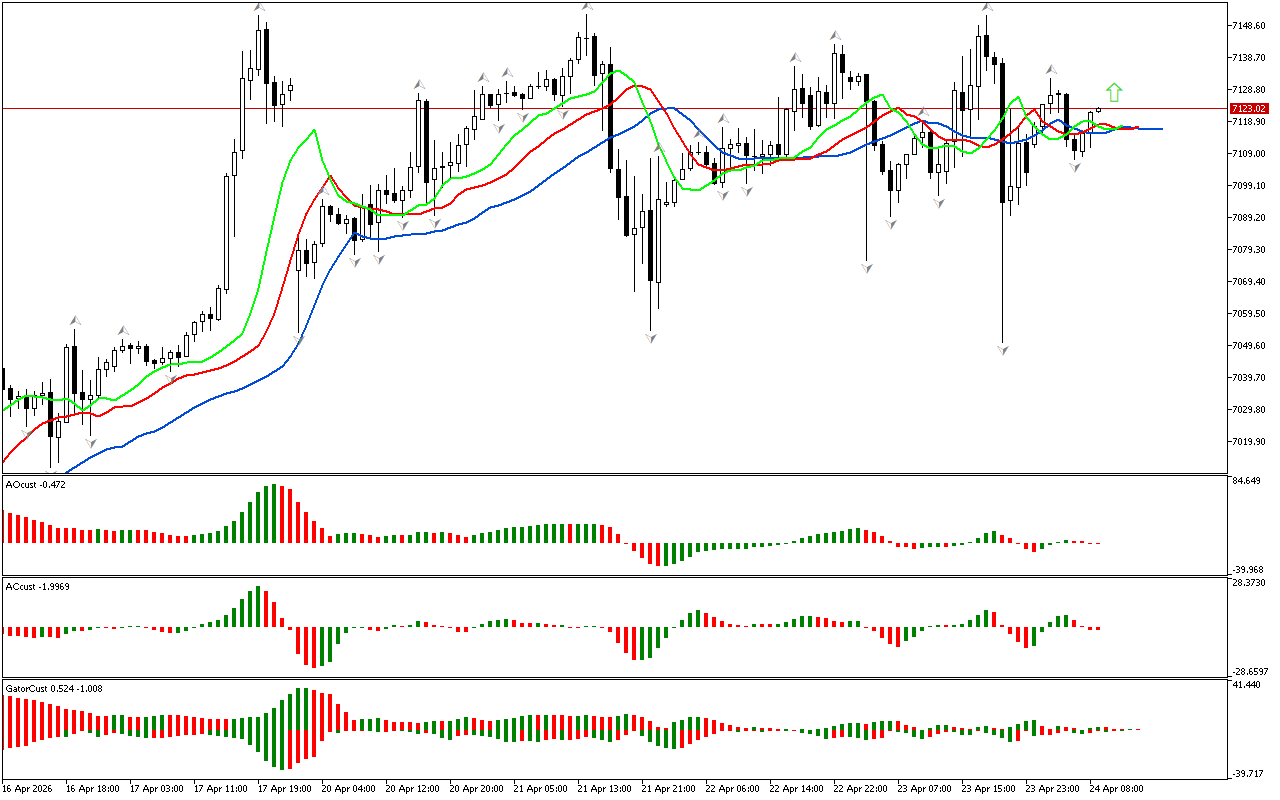
The price has risen above the upper fractal located above the Alligator’s mouth on the chart. Due to this signal, we define the phase space as a northern one and can examine the following 3 dimensions of the market.
Alligator lines also have laid in a northerly direction. This is a positive signal. Bill Williams compared this indicator to a compass, which determines the prevalence of the direction of price movement.
On the chart of the AO indicator, there is the zero line crossing from top to bottom. This is a sign indicating the market has sufficient strength to continue the movement in a southern direction.
The latest bars on the AC and AO charts are colored red. This is a signal that the strength and energy of the upward movement have deceleration. This signal does not contradict the prevalence of the upward movement, but indicates the development of a correction.
The color of the histograms of the Gator indicator changes, so this indicator has not formed a clear signal yet.
As a result, there is a northern phase space. At the same time, some indicators indicate the possible development of a pullback movement or the transition of the market to a new phase.
📊 Buy Stop 7132.27
❌ Stop Loss 7118.16
After entering the market, Stop Loss is carried along the red line after the closing of each candle. The profit is fixed by moving Stop Loss, or when opposite signals appear on the AO, AC, Gator indicators.
S&P 500 H1: The Chaos Theory Forecast for the European Session at 24.4.2026