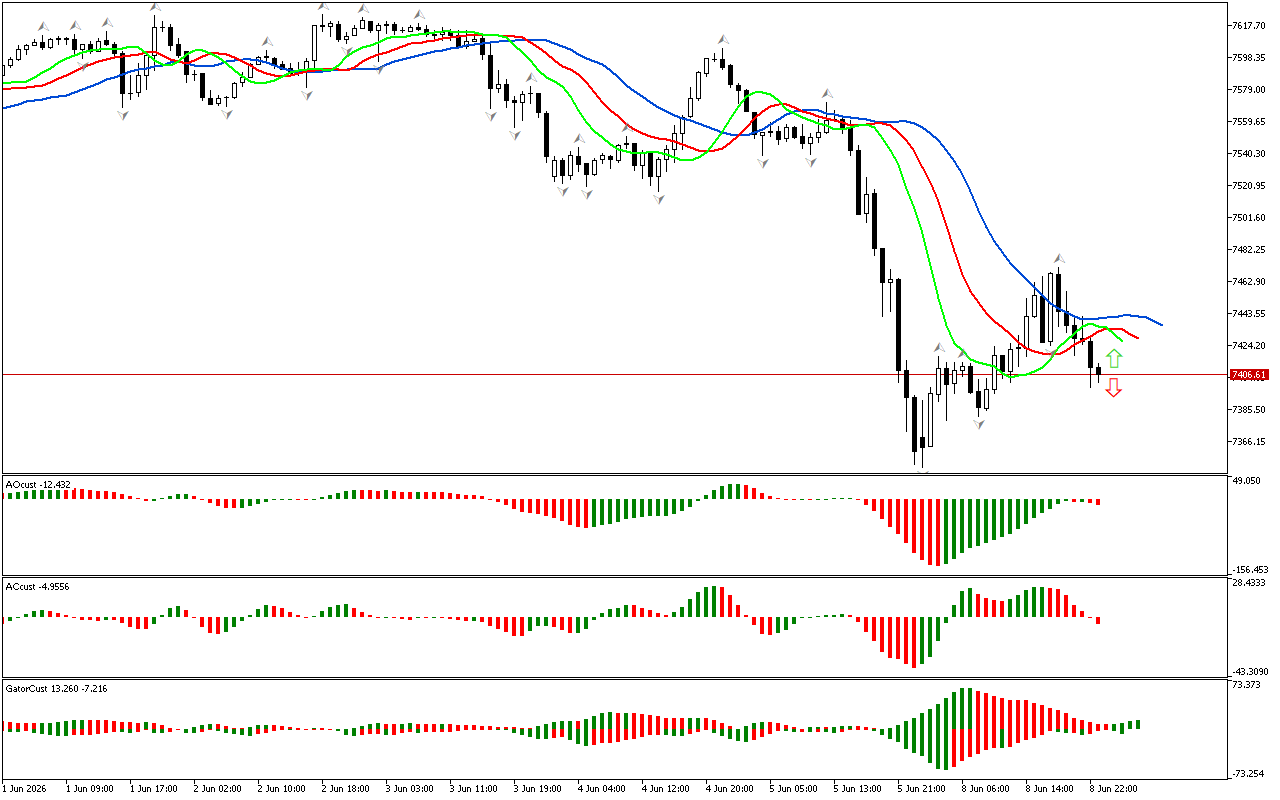
The analysis of the S&P 500 graph shows that the phase space is undefined. The price is between two fractals that can be used to determine the state of the market. According to Bill Williams’ Chaos Theory, attention should be paid only to fractals that are outside the Alligator’s mouth boundaries. Therefore, to determine the further prevalent direction of price movement, it is worth waiting for the price to cross the fractal.
The current chart shows the closed mouth of the Alligator, which indicates market uncertainty. In that case, it is worth staying out of the market and waiting for the Alligator to wake up. The Active Alligator represents a good earning opportunity.
The AO indicator shows an inverted Saucer. This is a signal indicating a possible resumption of the downward movement. During the southern phase of the market, entry points can be considered after the price falls below the local minimum.
Several green columns in a row have been formed on the Gator indicator. This indicates that the Alligator is hungry and its appetite is increasing.
Let’s summarize. The phase space is not defined. Therefore, it is worth ignoring the signals of other indicators for now and waiting for the breakdown of one of the fractals. This is a predictive event that will help determine the market phase and the priority direction of price movement.
📊 Buy Stop 7471.28
❌ Stop Loss 7419.77
✔️ Sell Stop 7381.11
❌ Stop Loss 7449.35
After entering the market, Stop Loss is moved along the red line after the closing of each candle. The profit is fixed by moving Stop Loss, or when impulse weakening signals appear on the AO, AC, Gator indicators.
S&P 500 H1: The Chaos Theory Forecast for the Asian Session on 9.6.2026