
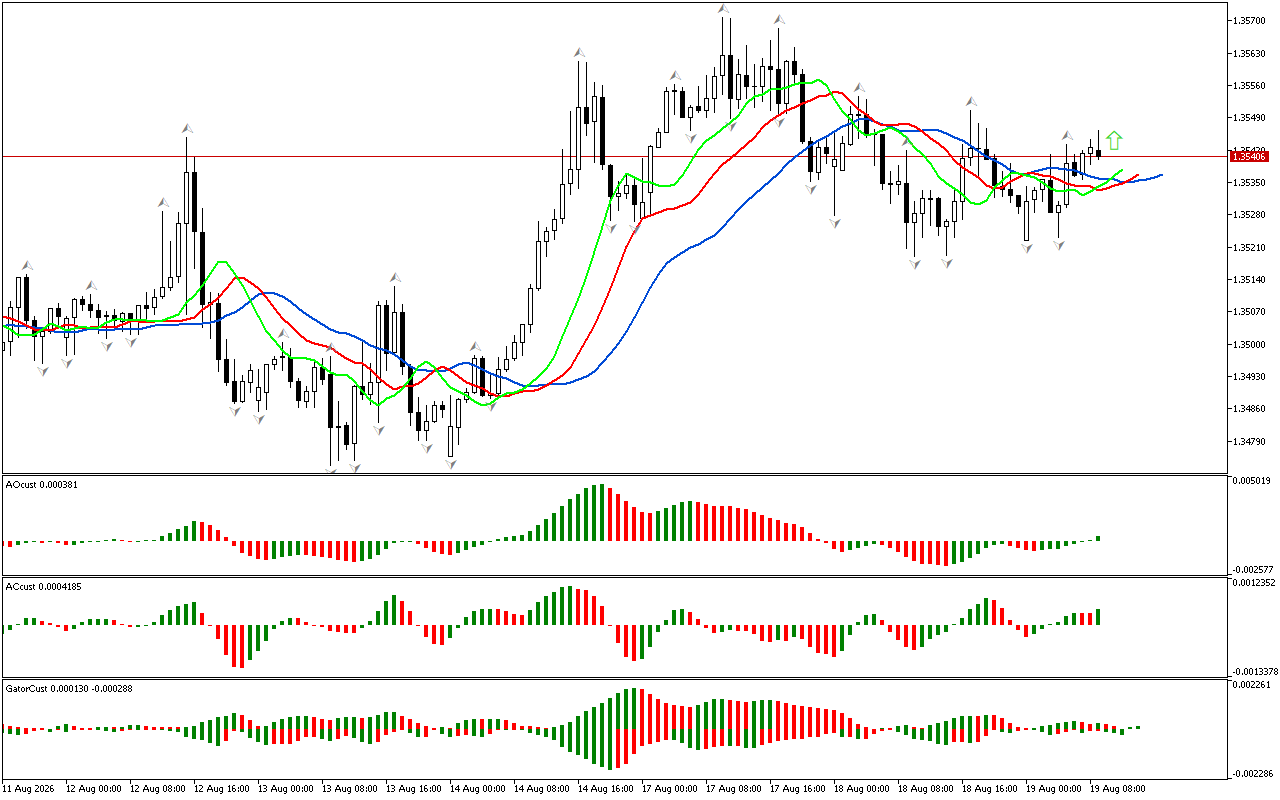
An analysis of the first phase of the market begins the review. The price is noted to have risen above the upper fractal on the chart. It determines the direction of the phase as northern. This signal indicates the possible start of an upward movement.
There is a series of the green bars on the AO indicator. The indicator crosses above the zero mark. This signals that there is a strength to continue the movement in the northern direction.
The red bars located above the zero mark on the Accelerator Oscillator indicator show a decrease in the energy of the upward movement. However, as long as the price remains above the Alligator’s red line, the price growth is expected.
The color of the histograms of the Gator indicator changes, so this indicator has not formed a clear signal yet.
As a result, there is a northern phase space. At the same time, some indicators indicate the possible development of a pullback movement or the transition of the market to a new phase.
📊 Buy Stop 1.35463
❌ Stop Loss 1.35358
After entering the market, Stop Loss is carried along the red line after the closing of each candle. The profit is fixed by moving Stop Loss, or when opposite signals appear on the AO, AC, Gator indicators.